Shiba Inu Surges 35% in a Week as SHIB Short Positions See $2.3 Million in Liquidations

Shiba Inu Surges Over 35% in a Week as Short Squeeze Fuels Rally
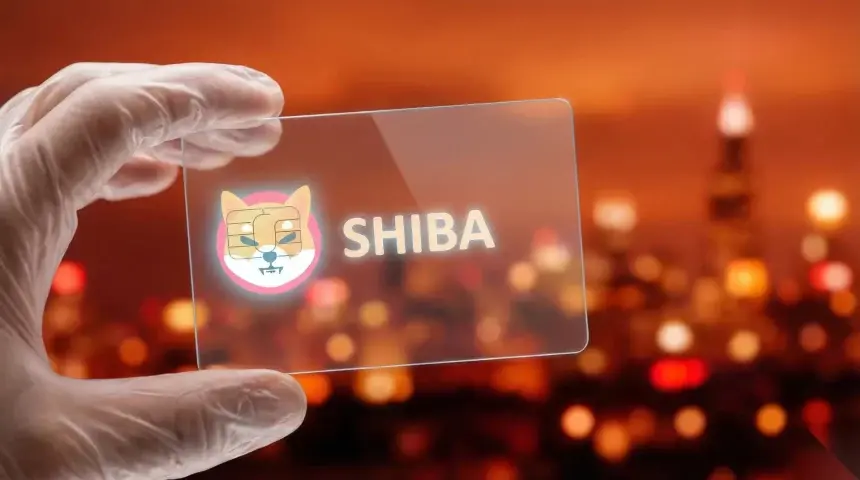
Shiba Inu (SHIB) gained more than 35% over the past week, marking a major breakout after months of trading in a downtrend with relatively weak market activity. The meme coin is now trading around $0.0000057, posting its strongest weekly rally in some time and catching many traders by surprise.
Long-Term Downtrend Faces Its First Major Test
SHIB peaked at around $0.0000340 in December 2024 before entering a prolonged downtrend throughout 2025. During that period, the token continued to form lower highs while remaining below a key descending trendline.
This week, SHIB tested that long-term trendline for the first time since it formed. Over the past seven days, the token rebounded from $0.00000409 and challenged the resistance line. Although the price briefly moved above it, SHIB has yet to secure a convincing weekly close above the trendline.
Despite the strong rally, SHIB is still trading well below major resistance levels. The 23.6% Fibonacci retracement of the 2024–2026 decline is located around $0.0000269, far above the current price. Meanwhile, the weekly Relative Strength Index (RSI) has only recently recovered from the low 30s, suggesting that while momentum has improved, a full trend reversal has not yet been confirmed.
Short Squeeze Drives the Price Jump
Derivatives market data suggests the rally was primarily driven by a short squeeze, where traders betting against SHIB were forced to close their positions as prices climbed.
Over the past 24 hours, total SHIB futures liquidations reached $2.32 million, with $1.77 million coming from short positions. At the same time, net inflows into SHIB futures surged by more than 2,000%, while open interest climbed to around $64.7 million, reflecting heightened trading activity and volatility.
Technical analysts believe the rally was largely fueled by leveraged positioning rather than any major fundamental news.
Intraday Charts Show Two-Leg Rally
On the 15-minute chart, SHIB’s rally unfolded in two phases. The first pushed the price from around $0.0000042 to nearly $0.00000504, followed by a brief consolidation that formed a bullish flag pattern.
After a shallow pullback, buying pressure returned and triggered the second breakout. An ascending trendline has continued to support the move, indicating that buyers remain active during minor price corrections.
Intraday RSI briefly reached 87, signaling strong bullish momentum. Although it cooled during consolidation, the indicator remains in the 70s, suggesting bullish sentiment is still intact, even as the risk of volatility increases if momentum weakens.
Key Levels to Watch
The main level traders are watching is the descending trendline from 2025, which sits close to SHIB’s current price. A confirmed weekly close above that level would mark the first such breakout in more than a year and could pave the way for further upside.
On lower timeframes, $0.0000048 remains an important support level. A break below it could weaken the short squeeze narrative and allow selling pressure to return.
While SHIB’s strong weekly rally has improved market sentiment, its next move will depend on whether it can hold above key technical levels. As always, technical and on-chain analysis should be used alongside proper risk management, as past breakouts do not guarantee future gains.