XRP Faces Critical Level, SHIB May Have Reached Its Bottom, Ethereum (ETH) Forms Bullish Signal

XRP Faces a Critical Juncture, SHIB Shows Early Signs of Recovery
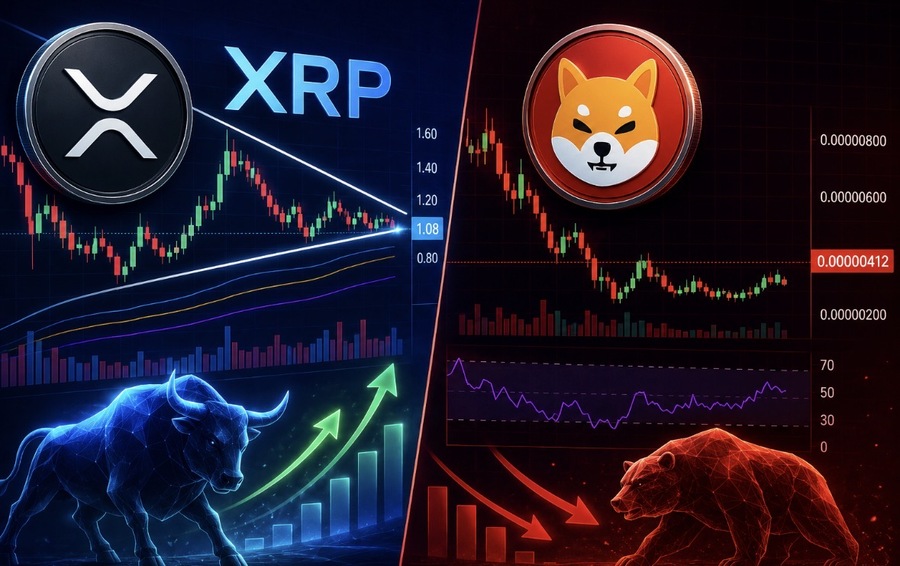
XRP has reached a key level that could determine its next price direction. After enduring months of selling pressure, the token is attempting to hold above the $1.08 area, although its technical outlook remains fragile.
On the daily chart, XRP is trading within a narrowing wedge pattern, a formation that often precedes a significant price move in either direction.
On the positive side, XRP is no longer making new lows. Since the sharp sell-off in June, buyers have consistently defended the $1.00–$1.05 support zone, leading to the formation of higher lows, a sign that buying interest is gradually returning.
However, major hurdles remain. XRP is still trading below its 20-day, 50-day, and 100-day Exponential Moving Averages (EMAs) at approximately $1.10, $1.14, and $1.25, respectively. Meanwhile, the 200-day EMA at $1.45 remains the key resistance level that must be reclaimed to confirm a long-term recovery.
Trading volume has also remained relatively low, indicating that buyers have yet to gain enough momentum to push the price above resistance, even though selling pressure has started to ease.
The Relative Strength Index (RSI) is hovering around 44, suggesting that momentum remains neutral to bearish. Although the RSI has climbed out of oversold territory, it is still below the 50 level, which is often associated with stronger bullish momentum.
In the short term, $1.05 remains the key support level. A break below this area could send XRP back to test the $1.00 psychological level and invalidate the recent higher-low structure.
On the upside, a move above $1.10 and a breakout from the descending trendline would provide the first signal that bulls are regaining control.
Overall, XRP has emerged from its sharp decline but has yet to confirm a convincing long-term recovery. The next major price move could determine XRP’s direction in the weeks ahead.
Meanwhile, Shiba Inu (SHIB) is beginning to show signs that a bottoming process may be underway after experiencing prolonged selling pressure.
SHIB is currently trading around $0.00000412. Although the broader trend remains bearish, the token is no longer posting fresh lows.
The RSI is sitting near 34, close to the oversold zone. Historically, this level has often indicated that selling pressure is fading and could be followed by a period of price stabilization, although it does not guarantee a trend reversal.
SHIB’s price action has also improved. Since the sharp decline in June, pullbacks have become shallower while volatility has eased. Such conditions are often seen when an asset is forming a market bottom.
Even so, SHIB’s technical outlook remains far from bullish. The token is still in a broader downtrend, meaning investors may need to wait for stronger confirmation before concluding that a sustained bullish reversal has begun.